
Cash Conversion Cycle: The Hidden Driver of Valuation
Introduction – The Valuation Gap Nobody Notices
In valuation practice, it is common to see two companies with similar revenue, margins, and growth profiles being valued very differently. At first glance, this may appear irrational. However, the answer often lies not in profitability metrics like EBITDA, but in how efficiently those profits convert into cash.
This is where the Cash Conversion Cycle (CCC) becomes critical. CCC is not merely an operational metric—it is a direct determinant of cash flow quality, capital efficiency, and ultimately, valuation.
To illustrate this, consider two companies operating in the same industry with identical financial performance at the EBITDA level. Despite this similarity, one company commands a significantly higher valuation. The key differentiator is how quickly each company converts its profits into cash.
This article explores CCC in depth and demonstrates, through a practical example, how working capital efficiency can create substantial valuation differences.
Understanding Cash Conversion Cycle (CCC)
The Cash Conversion Cycle measures the time required for a company to convert its investments in inventory and other resources into cash flows from sales. It captures the entire operating cycle from cash outflow to cash inflow.
The standard formula for CCC is:
CCC = Inventory Days (DIO) + Receivable Days (DSO) – Payable Days (DPO)
Each component reflects a key aspect of operations:
- Inventory Days (DIO): Time taken to sell inventory
- Receivable Days (DSO): Time taken to collect cash from customers
- Payable Days (DPO): Time taken to pay suppliers
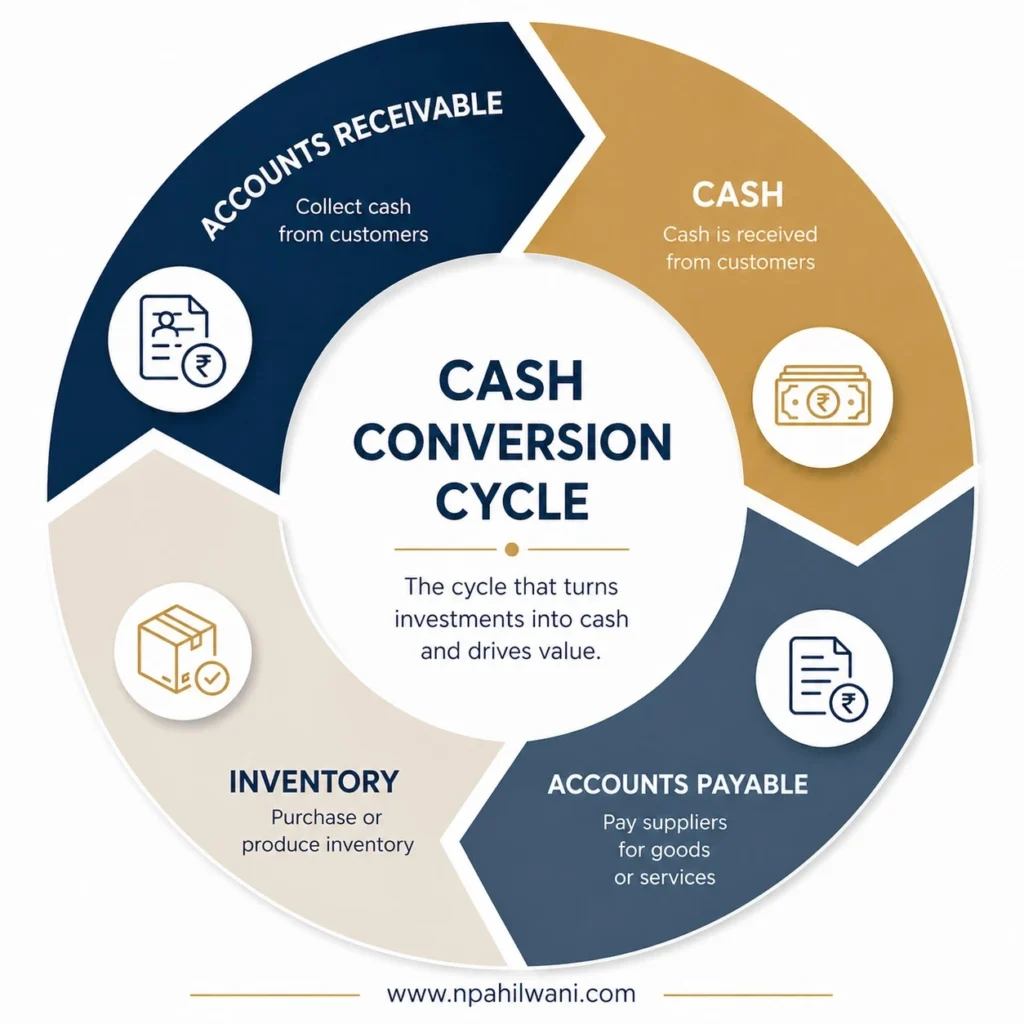
A shorter CCC indicates faster cash conversion and efficient working capital management. A longer CCC suggests that capital remains locked in operations for extended periods.
Importantly, CCC should not be viewed only as a liquidity measure. It is a capital efficiency metric that directly influences how much capital is required to sustain and grow a business.
Why CCC Matters in Financial Analysis
Cash Conversion Cycle plays a central role in financial analysis because it integrates three critical balance sheet components—inventory, receivables, and payables—into a single, actionable metric.
From an analytical perspective, CCC serves three key purposes:
Indicator of Working Capital Efficiency
CCC provides a holistic view of how effectively a company manages its working capital. It highlights inefficiencies that may not be visible when analyzing individual components separately.
Proxy for Liquidity Risk
A longer CCC implies that cash is tied up for extended periods, increasing dependence on external funding. Conversely, a shorter CCC enables businesses to fund operations internally.
Signal of Business Model Strength
Businesses with negative or low CCC—common in FMCG and retail—often benefit from strong pricing power and efficient distribution. In contrast, businesses with high CCC tend to be more capital-intensive and vulnerable to liquidity stress.
To understand how these factors translate into valuation outcomes, we now turn to a practical illustration.
Illustrative Case Study – FastCash Foods vs SlowCash Foods
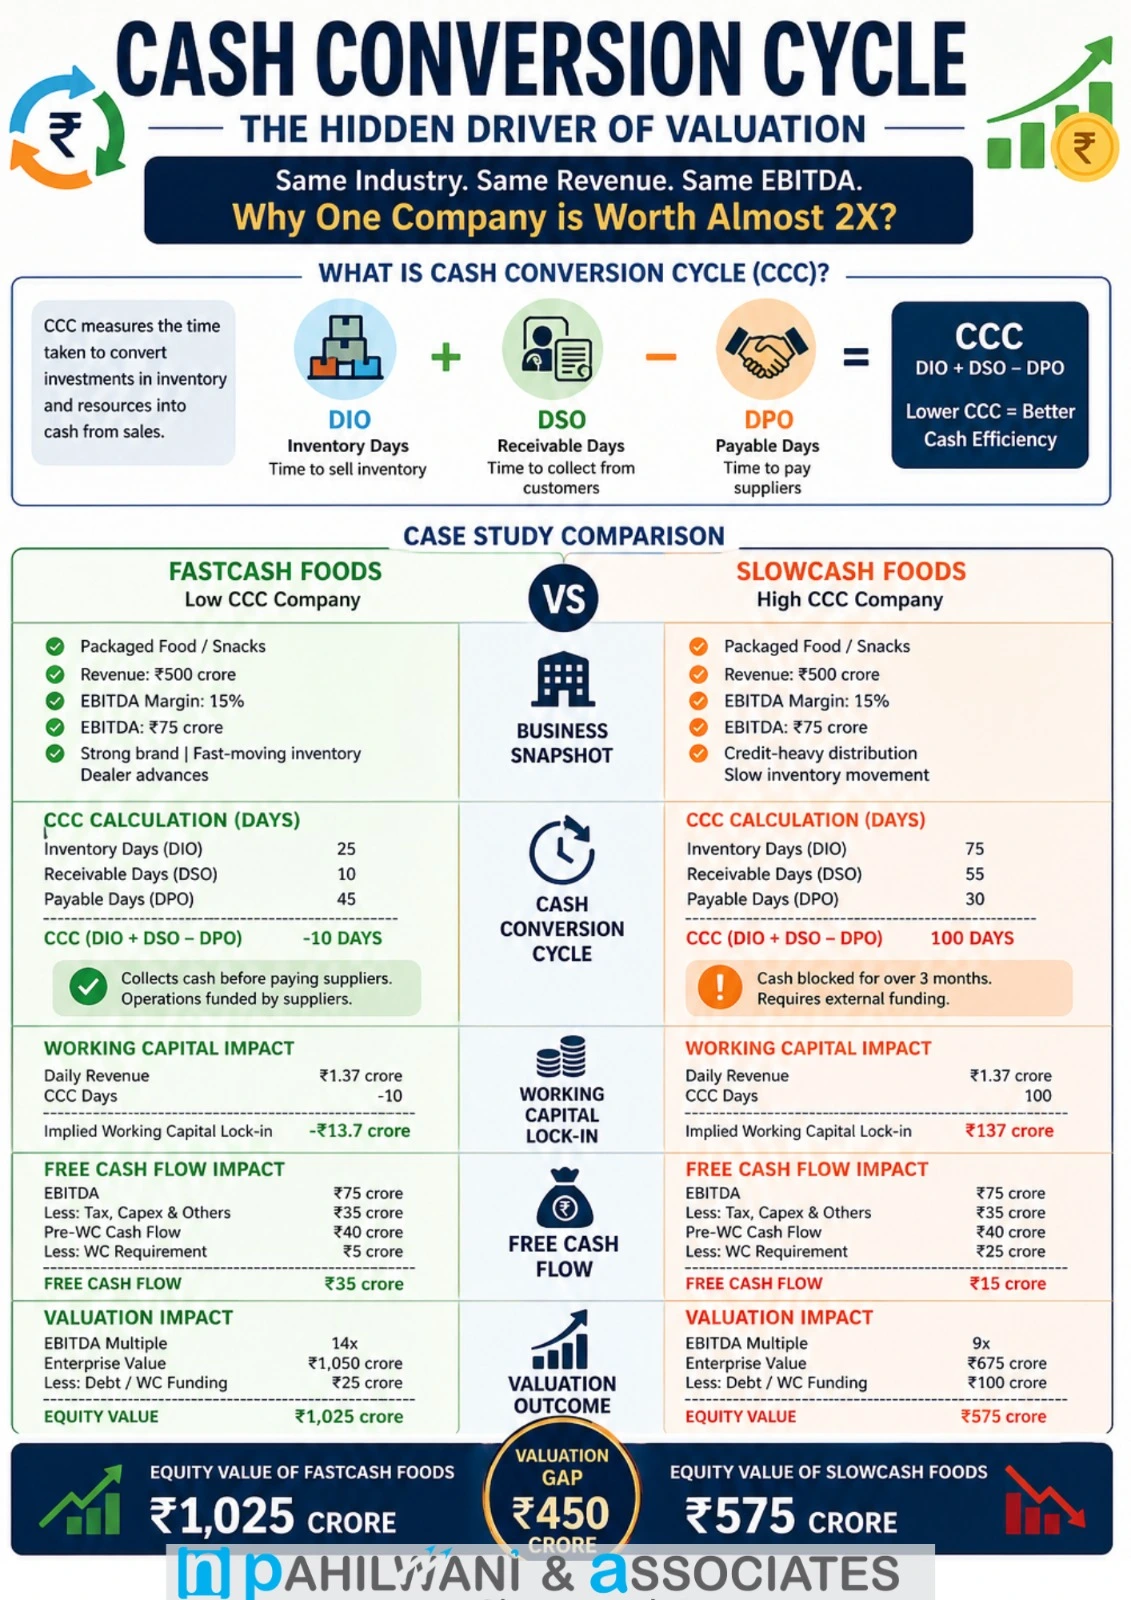
Business Overview
Consider two companies operating in the packaged food (FMCG) industry:
- Both generate ₹500 crore in annual revenue
- Both operate at an EBITDA margin of 15%
- Both have similar growth prospects
Despite identical operating performance, their working capital structures differ significantly.
| Particulars | FastCash Foods | SlowCash Foods |
| Revenue | ₹500 crore | ₹500 crore |
| EBITDA Margin | 15% | 15% |
| EBITDA | ₹75 crore | ₹75 crore |
| Business Model | Strong brand, fast-moving inventory | Credit-heavy, slower operations |
At the EBITDA level, both companies appear identical. However, the difference becomes evident when we analyze their Cash Conversion Cycles.
CCC Comparison
| Metric | FastCash Foods | SlowCash Foods |
| Inventory Days | 25 | 75 |
| Receivable Days | 10 | 55 |
| Payable Days | 45 | 30 |
| CCC | -10 days | 100 days |
Interpretation
- FastCash Foods operates with a negative CCC. It collects cash from customers before paying suppliers, effectively using supplier credit to fund operations.
- SlowCash Foods has a CCC of 100 days, meaning cash remains locked in the business for over three months.
This fundamental difference drives a cascade of financial and valuation impacts.
Working Capital Impact
To quantify the impact, assume daily revenue:
₹500 crore ÷ 365 ≈ ₹1.37 crore per day
| Particulars | FastCash Foods | SlowCash Foods |
| Daily Revenue | ₹1.37 crore | ₹1.37 crore |
| CCC | -10 days | 100 days |
| Working Capital Requirement | (-₹13.7 crore) | ₹137 crore |
Key Insight
FastCash Foods effectively generates cash ahead of its payment obligations, while SlowCash Foods requires approximately ₹137 crore of working capital to sustain operations.
This creates a ₹150 crore difference in capital requirement between two otherwise identical businesses.
Impact on Free Cash Flow
| Particulars | FastCash Foods | SlowCash Foods |
| EBITDA | ₹75 crore | ₹75 crore |
| Less: Taxes, Capex, Others | ₹35 crore | ₹35 crore |
| Pre-WC Cash Flow | ₹40 crore | ₹40 crore |
| Less: Working Capital Requirement | ₹5 crore | ₹25 crore |
| Free Cash Flow | ₹35 crore | ₹15 crore |
Interpretation
Although both companies generate identical EBITDA:
- FastCash Foods converts a larger portion into free cash flow
- SlowCash Foods experiences significant cash leakage due to working capital needs
This highlights a crucial point:
Profitability does not guarantee cash generation.
Valuation Impact
Assume valuation based on EBITDA multiples reflecting cash flow quality:
| Particulars | FastCash Foods | SlowCash Foods |
| EBITDA | ₹75 crore | ₹75 crore |
| Multiple | 14x | 9x |
| Enterprise Value | ₹1,050 crore | ₹675 crore |
| Less: Debt / WC Funding | ₹25 crore | ₹100 crore |
| Equity Value | ₹1,025 crore | ₹575 crore |
Valuation Difference
The valuation gap between the two companies is:
₹1,025 crore – ₹575 crore = ₹450 crore
Despite identical revenue and EBITDA, FastCash Foods commands a significantly higher valuation due to superior cash conversion efficiency.
What Drives This Valuation Difference
The higher valuation of FastCash Foods can be attributed to:
- Faster conversion of profits into cash
- Lower dependence on external funding
- Stronger return on capital employed
- Lower liquidity and operational risk
- Higher free cash flow generation
This demonstrates that CCC is a fundamental driver of business quality and investor perception.
Linking CCC to Valuation Framework
The impact of CCC extends across all major valuation approaches:
DCF Valuation
CCC directly affects the change in working capital, a key component of free cash flow:
- Higher CCC → higher working capital investment → lower free cash flow
- Lower CCC → reduced reinvestment → higher free cash flow
Even small changes in CCC assumptions can significantly impact valuation outcomes in a DCF model.
The impact of working capital assumptions becomes particularly important while applying DCF and market multiple approaches in valuation models.
Valuation Multiples
Investors assign higher multiples to businesses that:
- Generate consistent cash flows
- Require minimal reinvestment
- Exhibit low working capital intensity
Thus:
- Low CCC businesses command premium multiples
- High CCC businesses trade at a discount
Cost of Capital
CCC also influences perceived risk:
- High CCC → higher liquidity risk → higher cost of capital
- Low CCC → stable cash flows → lower cost of capital
This further amplifies valuation differences.
Working capital assumptions and cash conversion efficiency are often overlooked despite being critical drivers in business valuation models. You can explore this further in our guide on business valuation methods and common valuation mistakes.
Red Flags and Risk Indicators
Changes in CCC components can serve as early warning signals for underlying business issues:
- Increase in receivable days (DSO): Potential collection issues or aggressive revenue recognition
- Rising inventory days (DIO): Demand slowdown or inefficiencies in inventory management
- Declining payable days (DPO): Loss of bargaining power with suppliers
A deteriorating CCC profile may indicate:
- Weakening earnings quality
- Growing working capital stress
- Increased risk of valuation discount
Conclusion – Reframing Valuation Thinking
Traditional valuation approaches often focus on revenue growth and profitability. However, these metrics alone do not capture the true economic value of a business.
Cash Conversion Cycle provides a deeper insight into how efficiently a company transforms its profits into cash. As demonstrated in the example of FastCash Foods and SlowCash Foods, two companies with identical operating performance can have vastly different valuations purely due to differences in working capital efficiency.
In essence:
- Revenue drives scale
- Margins drive profitability
- CCC determines how much of that profit translates into real, distributable value
For valuers, investors, and CFOs, CCC should not be treated as a secondary metric. It is a core determinant of valuation, risk, and long-term value creation.
In valuation, not all profits are equal—the speed at which profits convert into cash ultimately defines business value.